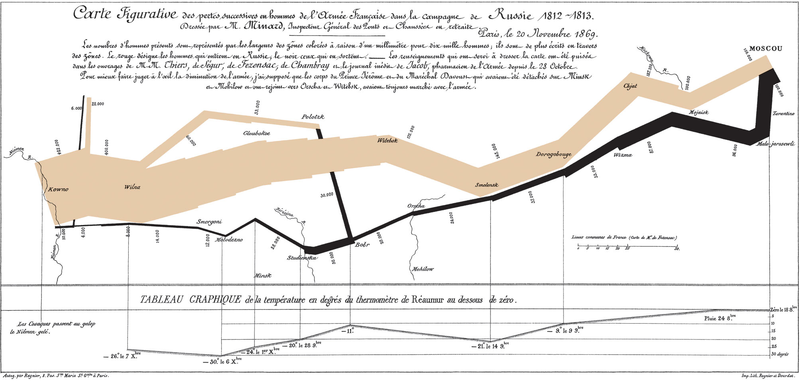
I've recently had to think through two problems related to tracking cohorts over time, and each time I've mentally referred back to what is considered by some to be the greatest data visualization of all time. Charles Joseph Minard, an engineer, created the graphic below: "Carte figurative des pertes successives en hommes de l'Armée Française dans la campagne de Russie 1812-1813" (loosely translated as "don't follow Napoleon or anyone else when launching a land war in Asia").

This single picture shows the size of the army as it entered Russia, then the size as it left, their relative geographic location, groups leaving and re-entering the force, and the temperature the army faced as they returned. And to me it meets one of the main tests for "is this graphic great?" -- it sticks in my head and I find myself referring back to it again and again.